Throttle Buff is reader-supported: we may earn a commission when you buy through links on this page. Learn more.
6,228 motorcyclists were killed in traffic crashes in the U.S. in 2024, down 2.2% from 6,366 in 2023, and they made up 16% of all traffic deaths. Per registered vehicle, 67.25 motorcyclists died for every 100,000 motorcycles on the road. These are the key motorcycle accident statistics from NHTSA’s newest report, released in July 2026.
Every figure below comes straight from NHTSA’s Traffic Safety Facts: Motorcycles, 2024 Data. Bloggers, journalists and safety trainers are welcome to cite this page.
Motorcycle accident statistics at a glance (2024)
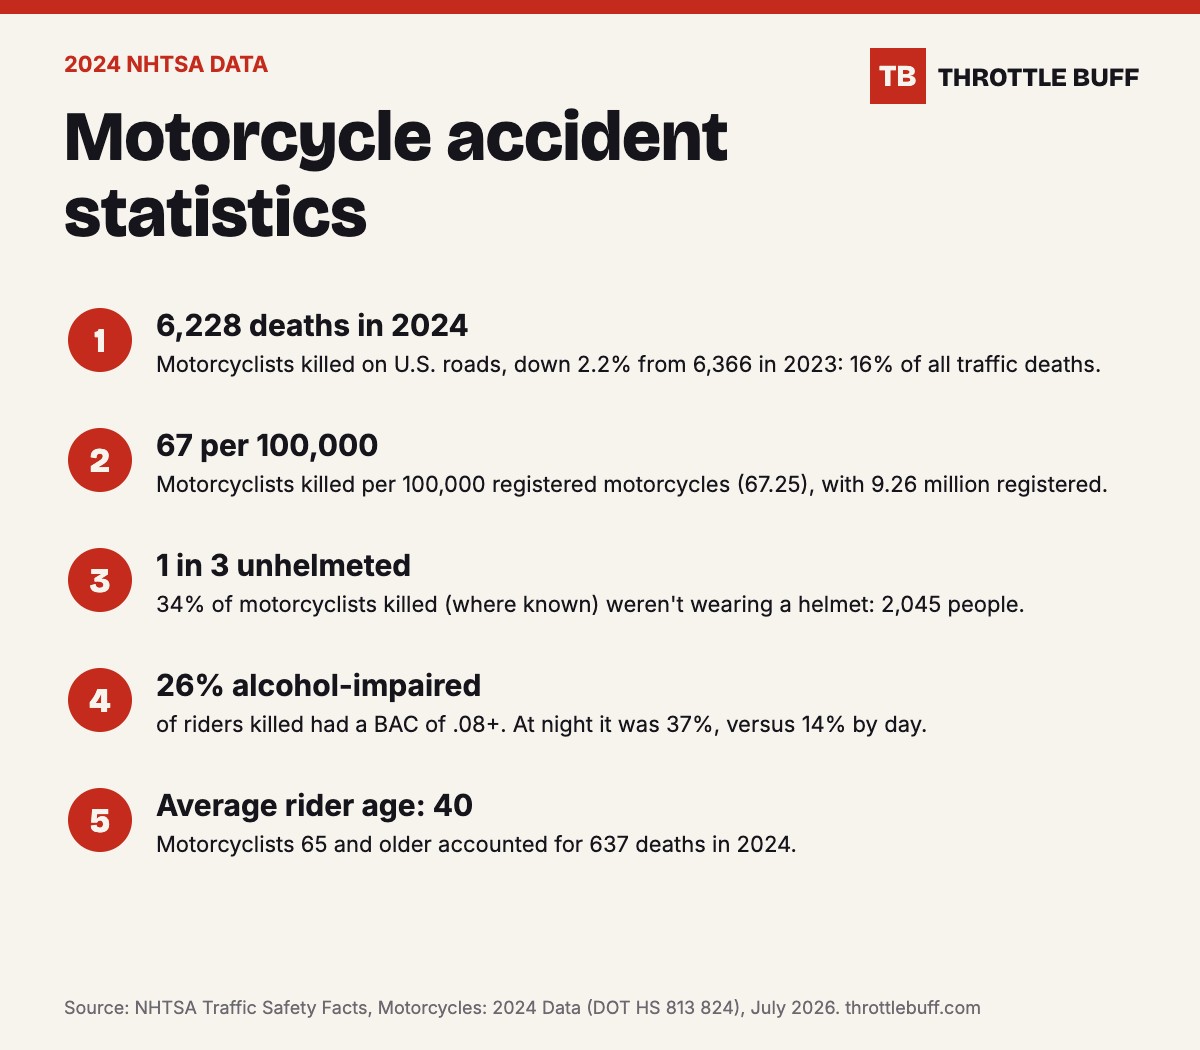
- 6,228 motorcyclists killed, 16% of all U.S. traffic fatalities.
- 67.25 motorcyclists killed per 100,000 registered motorcycles (9,261,249 registered), up slightly from 66.89 in 2023.
- 34% of motorcyclists killed with known helmet use weren’t wearing a helmet: 2,045 people.
- 26% of riders killed were alcohol-impaired (BAC .08+): 1,529 of 5,950.
- 40 was the average age of motorcycle riders killed.
- 46% of motorcyclist deaths happened on weekends.
- 56% of fatal motorcycle crashes happened in daylight, 38% in the dark.
Helmet statistics
Reported helmet use among motorcyclists killed in 2024 was 67% for riders and 48% for passengers. Helmet laws make a large difference: 48% of motorcyclists killed in states without universal helmet laws weren’t wearing one, compared with 11% in states with universal laws. Our helmet law study ranks every state.
Alcohol and helmets overlap: reported helmet use was 59% for alcohol-impaired riders killed, against 70% for riders with no alcohol in their system.
Alcohol statistics
26% of motorcycle riders killed in 2024 had a BAC of .08 g/dL or higher, the same share as in 2023. Another 8% (472 riders) had lower levels between .01 and .07. Motorcycle riders and passenger-car drivers in fatal crashes had the highest impairment rates of any vehicle type, at 25% each.
| Crash type (2024) | Riders killed | Alcohol-impaired | Share |
|---|---|---|---|
| Single-vehicle crashes | 2,125 | 848 | 40% |
| Multi-vehicle crashes | 3,825 | 681 | 18% |
| Weekday | 3,235 | 668 | 21% |
| Weekend | 2,703 | 855 | 32% |
| All | 5,950 | 1,529 | 26% |
Riders killed at night were 2.6 times as likely to be impaired as those killed by day (37% vs 14%). See our drunk riding deaths by state study for every state’s figure.
Age statistics
The average age of motorcycle riders killed in 2024 was 40. Deaths are spread widely across age groups, with the most among motorcyclists aged 21 to 34 and those 65 and older.
| Age group | Motorcyclists killed, 2023 | Motorcyclists killed, 2024 |
|---|---|---|
| Under 15 | 14 | 30 |
| 15–20 | 508 | 609 |
| 21–24 | 613 | 705 |
| 25–29 | 767 | 706 |
| 30–34 | 693 | 698 |
| 35–39 | 581 | 582 |
| 40–44 | 569 | 529 |
| 45–49 | 496 | 426 |
| 50–54 | 517 | 461 |
| 55–59 | 508 | 443 |
| 60–64 | 471 | 400 |
| 65+ | 626 | 637 |
| Total (incl. unknown) | 6,366 | 6,228 |
Deaths among motorcyclists aged 15 to 20 rose from 508 to 609, a 20% jump in one year. The highest alcohol-impaired share was in the 30-to-34 age group (35%). New riders should start with the right protection: see the best beginner motorcycle helmets and our beginner gear checklist.
Engine size statistics
Most motorcyclists killed were on mid-size bikes: 37% were on motorcycles of 501 to 1,000cc.
| Engine size | Motorcyclists killed, 2024 | Share |
|---|---|---|
| Up to 500cc | 739 | 12% |
| 501–1,000cc | 2,294 | 37% |
| 1,001–1,500cc | 1,206 | 19% |
| 1,501cc and over | 1,592 | 26% |
| Unknown | 397 | 6% |
When and where crashes happen
- 46% of motorcyclist deaths happened on weekends in 2024 (47% in 2023).
- 56% of fatal crashes happened in daylight, 38% in the dark, 4% at dusk and 1% at dawn.
- Florida (642), Texas (583) and California (522) had the most motorcyclist deaths of any state.
How to lower your risk
- Wear a DOT, ECE 22.06 or Snell-certified helmet every ride. Our guide to helmet types explains the trade-offs.
- Never ride after drinking, especially at night and on weekends, when impaired crashes peak.
- Choose a bike with ABS and consider an airbag vest.
- Replace an old helmet: see when motorcycle helmets expire.
- Take a rider training course and review NHTSA’s motorcycle safety guidance.
Riding in New Zealand? See our NZ motorcycle crash statistics by region.
Sources
All statistics come from NHTSA’s Traffic Safety Facts: Motorcycles, 2024 Data (DOT HS 813 824, July 2026), based on the Fatality Analysis Reporting System. “Motorcyclists” includes riders and passengers; “riders” means operators only. 2024 figures come from FARS’s Annual Report File and may be revised.
Cite or embed this page
You’re welcome to use these statistics and the infographic with a credit link to this page. Data on this page is shared under CC BY 4.0. Embed code:
<a href="https://throttlebuff.com/motorcycle-accident-statistics/"><img src="https://throttlebuff.com/wp-content/uploads/2026/11/motorcycle-accident-statistics-infographic.jpg" alt="Motorcycle accident statistics 2024" width="1200" height="1050"></a><br>Source: <a href="https://throttlebuff.com/motorcycle-accident-statistics/">Throttle Buff</a>
FAQ
How many motorcycle deaths are there per year in the U.S.?
6,228 motorcyclists were killed in 2024 and 6,366 in 2023, according to NHTSA.
What percentage of traffic deaths are motorcyclists?
16% of all U.S. traffic fatalities in 2024 were motorcyclists.
What is the motorcycle fatality rate?
67.25 motorcyclists were killed per 100,000 registered motorcycles in 2024, up from 66.89 in 2023.
What percentage of motorcyclists killed weren’t wearing helmets?
34% of motorcyclists killed with known helmet use weren’t wearing one in 2024: 2,045 people.
What age group has the most motorcycle deaths?
In 2024 the 25–29 (706) and 21–24 (705) age groups had the most motorcyclist deaths, closely followed by 30–34 (698) and 65+ (637).
Browse all our how-to and safety guides.