Throttle Buff is reader-supported: we may earn a commission when you buy through links on this page. Read our affiliate disclosure.
For years, the typical motorcyclist killed on U.S. roads was getting older. That has flipped. In 2024, 2,050 of the 6,228 motorcyclists killed were under 30, and 1,941 were 50 or older. It’s the first time in the last 10 years of NHTSA’s annual motorcycle reports that riders and passengers under 30 outnumbered those 50 and up.
We pulled the age tables from every NHTSA Traffic Safety Facts: Motorcycles report from 2015 to 2024. The full data, method and sources are below, and the tables and infographic are free to republish with a link back to this page.
Key findings
- Under 30 overtook 50+. Motorcyclists under 30 made up 32.9% of deaths in 2024 (2,050), compared with 31.2% for those 50 and older (1,941). In 2019 the split was 27.5% versus 37.3%.
- Young rider deaths are up 39% in three years. Deaths under 30 rose from 1,470 in 2021 to 2,050 in 2024, while total motorcyclist deaths rose 5% over the same period (5,932 to 6,228).
- The biggest one-year jump was among 15 to 20 year olds. Deaths in that group rose 20%, from 508 in 2023 to 609 in 2024. Ages 21 to 24 rose 15%, from 613 to 705. Total deaths fell 2% that year.
- The average age of riders killed is falling. It was 42 or 43 every year from 2015 to 2021, then 42 in 2022, 41 in 2023 and 40 in 2024.
- Young riders in fatal crashes were far more likely to be speeding. 56% of riders aged 15 to 20 involved in fatal crashes in 2024 were speeding, against 14% of riders 65 and older.
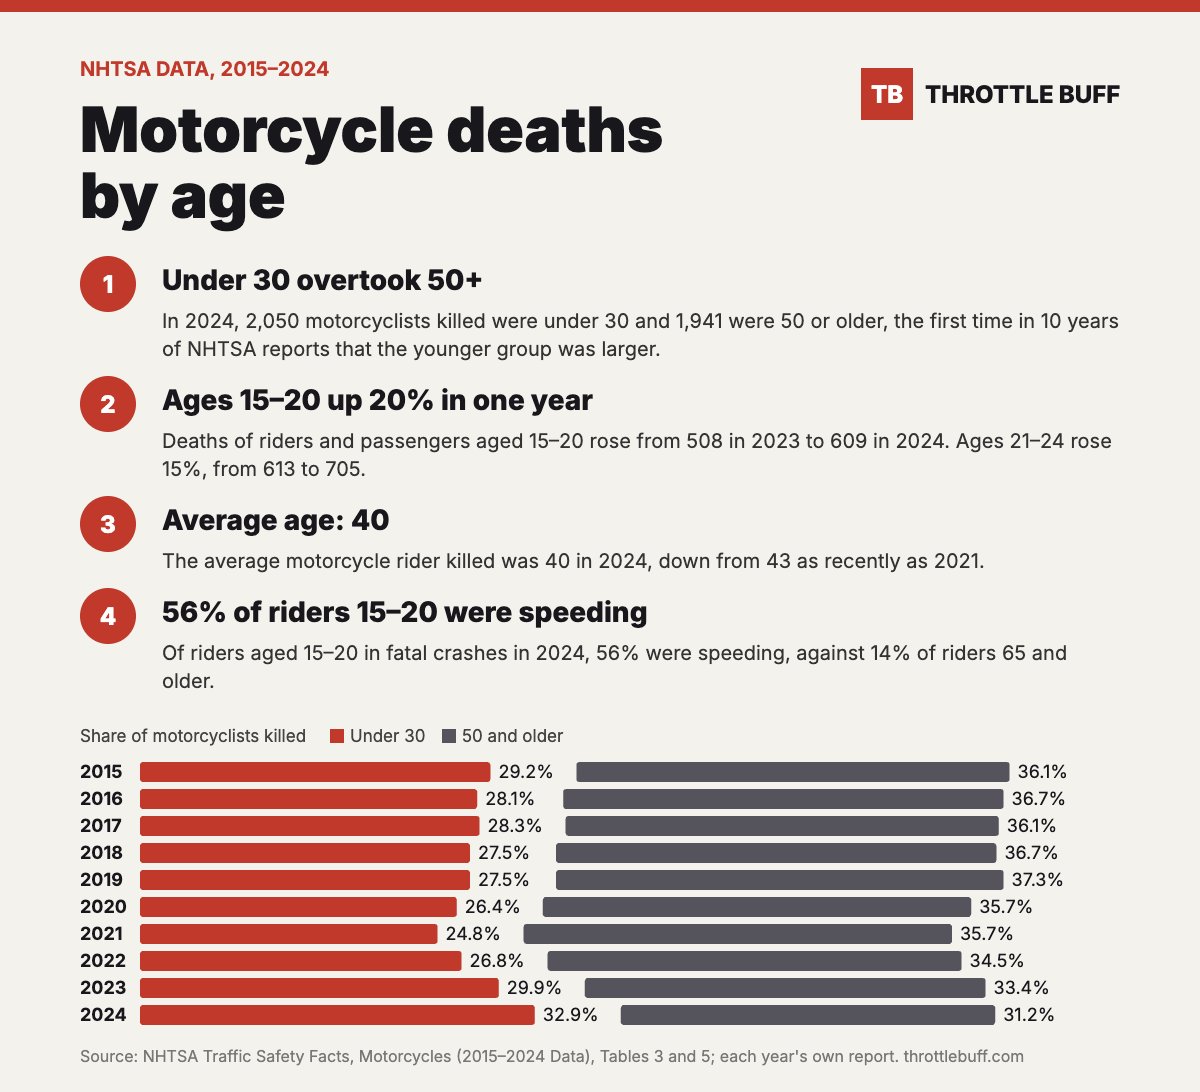
Motorcycle deaths by age, 2015–2024
Motorcyclists killed (riders and passengers) in each year, from that year’s NHTSA report. Shares are of all motorcyclists killed, including the few of unknown age.
| Year | Total killed | Under 30 | Under 30 share | 50 and older | 50+ share | Average age of riders killed |
|---|---|---|---|---|---|---|
| 2015 | 4,976 | 1,454 | 29.2% | 1,796 | 36.1% | 42 |
| 2016 | 5,286 | 1,488 | 28.1% | 1,940 | 36.7% | 43 |
| 2017 | 5,172 | 1,462 | 28.3% | 1,868 | 36.1% | 42 |
| 2018 | 4,985 | 1,372 | 27.5% | 1,829 | 36.7% | 43 |
| 2019 | 5,014 | 1,377 | 27.5% | 1,872 | 37.3% | 43 |
| 2020 | 5,579 | 1,475 | 26.4% | 1,992 | 35.7% | 43 |
| 2021 | 5,932 | 1,470 | 24.8% | 2,120 | 35.7% | 43 |
| 2022 | 6,218 | 1,668 | 26.8% | 2,145 | 34.5% | 42 |
| 2023 | 6,335 | 1,895 | 29.9% | 2,115 | 33.4% | 41 |
| 2024 | 6,228 | 2,050 | 32.9% | 1,941 | 31.2% | 40 |
Which age groups changed most in 2024
From NHTSA’s 2024 report, which compares final 2023 counts with 2024 counts. Total deaths fell from 6,366 to 6,228, but the youngest groups rose sharply while every group from 40 to 64 fell.
| Age group | 2023 | 2024 | Change |
|---|---|---|---|
| Under 15 | 14 | 30 | +16 |
| 15–20 | 508 | 609 | +20% |
| 21–24 | 613 | 705 | +15% |
| 25–29 | 767 | 706 | −8% |
| 30–34 | 693 | 698 | +1% |
| 35–39 | 581 | 582 | 0% |
| 40–44 | 569 | 529 | −7% |
| 45–49 | 496 | 426 | −14% |
| 50–54 | 517 | 461 | −11% |
| 55–59 | 508 | 443 | −13% |
| 60–64 | 471 | 400 | −15% |
| 65+ | 626 | 637 | +2% |
Motorcyclists 65 and older are the exception among older groups: their deaths held steady at about 10% of the total, 637 in 2024.
Speeding by age
NHTSA also breaks down speeding by rider age. These figures cover all riders involved in fatal crashes in 2024, not only those who died.
| Rider age | Riders speeding | Share speeding |
|---|---|---|
| 15–20 | 343 | 56% |
| 21–24 | 373 | 52% |
| 25–29 | 355 | 48% |
| 30–34 | 305 | 43% |
| 35–39 | 238 | 41% |
| 40–44 | 188 | 34% |
| 45–49 | 141 | 33% |
| 50–54 | 112 | 24% |
| 55–59 | 96 | 21% |
| 60–64 | 74 | 18% |
| 65+ | 93 | 14% |
| All ages | 2,322 | 37% |
The pattern is steady: each older age group is less likely to be speeding. More than half of riders under 25 in fatal crashes were speeding.
What’s behind the shift
NHTSA’s tables show what changed, not why. A few things are worth keeping in mind when reading them:
- Older riders still die in large numbers. 1,941 motorcyclists 50 and older were killed in 2024. The share fell because deaths among younger riders rose, and because deaths in the 40 to 64 range dropped.
- Speed is a bigger factor for young riders. The speeding table above is the clearest age difference in the data.
- Alcohol peaks in the middle. NHTSA reports the highest alcohol-impaired share among riders aged 30 to 34 (35%). See our drunk riding deaths by state study.
- Licensing is a gap at every age. NHTSA reports that 35% of riders in fatal crashes in 2024 didn’t have a valid motorcycle license. It doesn’t publish this by age.
Staying safe if you’re a new or young rider
- Take a rider training course before you ride on the street, and get properly licensed.
- Wear a helmet every ride, whatever your state’s law says. Our helmet law study shows how unhelmeted deaths vary by state, and many states’ helmet laws only cover riders under 18 or 21.
- Pick a bike you can handle, ideally with ABS. See how motorcycle ABS works.
- Gear up beyond the helmet: start with our beginner gear checklist, a well-rated helmet and an airbag vest.
For the national picture, see our motorcycle accident statistics fact sheet.
Methodology and sources
All figures come from NHTSA’s annual Traffic Safety Facts: Motorcycles reports, built on the Fatality Analysis Reporting System (FARS). Each year’s row uses that year’s own report: 2024 (DOT HS 813 824), 2023 (813 732), 2022 (813 589), 2021 (813 466), 2020 (813 306), 2019 (813 112), 2018 (812 979), 2017 (812 785), 2016 (812 492) and 2015 (812 353). Age counts are from Table 3 of each report. The 2023 to 2024 comparison uses the 2024 report, which revises 2023 to its final count. Speeding by age is from Table 5 of the 2024 report.
Notes: counts include riders and passengers; the average age is for riders only. NHTSA publishes counts, not shares, by age, so all percentages and the under 30 and 50+ totals are our sums of NHTSA’s age groups. Reports from 2015 to 2018 publish only four broad age bands, so the 65+ group is available from 2019 on. Later reports revise earlier years slightly, and from 2022 NHTSA excludes motorized bicycles. The 2024 figures are from NHTSA’s preliminary 2024 file.
Use this data
Journalists, bloggers and rider-safety groups are welcome to use the tables and infographic. Please credit Throttle Buff with a link to this page. Data on this page is shared under CC BY 4.0. To embed the infographic, copy this code:
<a href="https://throttlebuff.com/motorcycle-deaths-by-age/"><img src="https://throttlebuff.com/wp-content/uploads/2026/11/motorcycle-deaths-by-age-infographic.jpg" alt="Motorcycle deaths by age, 2015-2024" width="1200" height="1092"></a><br>Source: <a href="https://throttlebuff.com/motorcycle-deaths-by-age/">Throttle Buff</a>Questions about the data? Contact the editor.
See all our motorcycle safety studies on Research and data.
FAQ
What age group has the most motorcycle deaths?
In 2024, the 25 to 29 group had the most deaths of any NHTSA age group (706), just ahead of 21 to 24 (705) and 30 to 34 (698). Combined, motorcyclists under 30 accounted for 2,050 deaths, more than those 50 and older (1,941).
What is the average age of motorcyclists killed?
40 in 2024, according to NHTSA. It was 43 as recently as 2021.
Are motorcycle deaths rising among young riders?
Yes. Deaths under 30 rose from 1,470 in 2021 to 2,050 in 2024. From 2023 to 2024 alone, deaths of 15 to 20 year olds rose 20% and 21 to 24 year olds rose 15%, while total deaths fell 2%.
Are older riders more likely to die in a crash?
This data counts deaths, not risk per rider or per mile, so it can’t show which age group is more likely to die per ride. It does show that older riders made up a shrinking share of deaths from 2019 to 2024.
Browse all our how-to and safety guides.